Stagflation and Deflation: When Prices and Growth Go Wrong
Most of the time, prices and growth move together. Stagflation and deflation are what happens when that relationship breaks. Here is how each one works, why they are so hard to fix, and how close today's economies are to either.
Key points
- Stagflation is high inflation combined with weak growth and rising unemployment. It usually follows a supply shock, such as a jump in oil prices.
- Deflation is a sustained fall in the general price level. It sounds good for shoppers but can trap an economy in falling spending, falling wages and heavier debts.
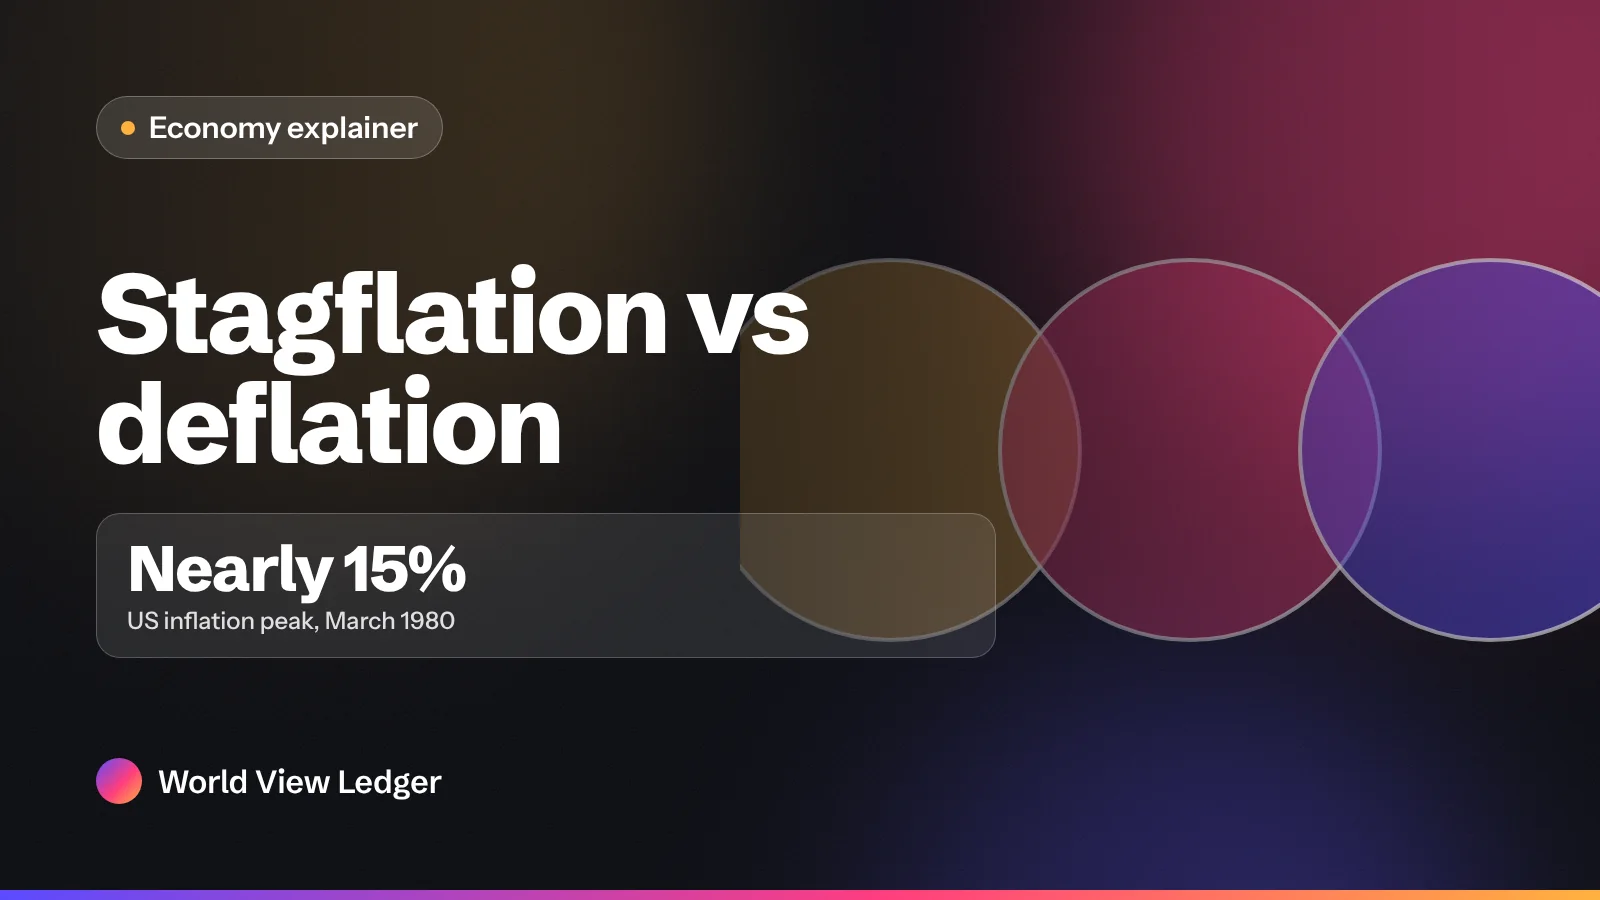
- The classic stagflation was the 1970s: US inflation peaked near 15% in March 1980, and ending it took interest rate hikes and two recessions.
- Japan is the classic deflation case: prices drifted lower for about 15 years from the late 1990s, averaging around minus 0.3% a year.
- As of November 2026, the Middle East energy shock has pushed inflation up in the US, UK and Australia. Australia, where growth is slowing and unemployment rising, is closest to the textbook definition of stagflation.
What is stagflation? Stagflation is an economy suffering from high inflation and stagnation at the same time: prices rise quickly while growth stalls and unemployment climbs. Deflation is the opposite price problem, a sustained fall in the general level of prices, usually alongside weak demand. Both break the normal pattern in which prices and growth rise and fall together, and both are among the hardest situations a central bank can face.
This guide explains what causes each one, how the 1970s, the Great Depression and Japan's lost decades played out, why the usual policy tools struggle, and where the US, UK, Australia and UAE stand as of November 2026, with an energy shock pushing prices higher across much of the world.
Stagflation explained: two problems at once
In a typical business cycle, inflation and growth move in the same direction. When the economy is booming, firms hire, workers spend, and strong demand pushes prices up. When it slumps, demand falls and inflation cools. The Federal Reserve Bank of Cleveland defines stagflation as economic stagnation, meaning slowing growth and higher unemployment, combined with rising inflation. It notes that this is unusual precisely because inflation tends to rise in strong, not weak, economies.
The word itself, a blend of "stagnation" and "inflation", is generally credited to the British politician Iain Macleod, who used it in the House of Commons in 1965. It became a household term a decade later, when much of the developed world lived through it.
Economists usually look for three ingredients together:
- Inflation well above target, for most central banks meaning clearly above 2% and not falling.
- Weak or negative growth in real GDP, the economy's output after adjusting for inflation.
- Rising unemployment, as firms facing higher costs and weaker sales cut jobs.
High inflation with strong growth is simply an overheating economy. Weak growth with low inflation is a normal slowdown. It is the combination that makes stagflation distinctive.
What causes stagflation?
The most common trigger is a supply shock: a sudden jump in the cost, or a collapse in the availability, of something the whole economy depends on. Energy is the classic example. When oil becomes much more expensive, transport, manufacturing, food and heating costs all rise. Firms pass some of that on as higher prices and absorb the rest through lower profits, fewer hires and less investment. The economy ends up producing less while charging more.
Other contributors can turn a shock into a lasting problem:
- Inflation expectations. If households and businesses come to expect high inflation, workers push for bigger pay rises and firms raise prices pre-emptively, which keeps inflation going even after the original shock fades.
- Policy that stays too loose. Central banks that keep interest rates low to protect jobs can let inflation become entrenched.
- Weak productivity. When output per worker stops improving, wage rises translate more directly into price rises.
- Trade disruption. Tariffs, sanctions or blocked shipping routes raise the cost of imported goods while reducing trade.
The 1970s: the textbook case of stagflation
The 1970s turned stagflation from a curiosity into a defining economic problem. According to Federal Reserve History, the period economists call the Great Inflation ran from 1965 to 1982. In 1964, US inflation was about 1% and unemployment about 5%. Roughly a decade later, inflation was above 12% and unemployment above 7%.
A timeline of the Great Inflation
| When | What happened |
|---|---|
| 1965 | US inflation starts a long climb from around 1%. |
| October 1973 | The Arab oil embargo begins. It lasts about five months, and crude prices quadruple. |
| 1979 | The Iranian revolution triggers a second oil crisis, tripling the cost of oil. |
| August 1979 | Paul Volcker becomes Fed chairman with inflation above 11%. In October the Fed shifts to targeting the growth of bank reserves, and interest rates spike. |
| March 1980 | Consumer price inflation peaks at close to 15%. |
| 1980 to 1982 | Two recessions follow. Unemployment peaks at nearly 11%, and by the end of 1982 inflation is back under 5%. |
Why the old rulebook failed
In the 1960s many policymakers relied on the Phillips curve, an observed trade-off in which lower unemployment came with higher inflation. The idea was that a country could "buy" permanently lower unemployment by accepting a little more inflation. Economists Edmund Phelps and Milton Friedman warned in the late 1960s that the trade-off would not last: once people expected higher inflation, it would take ever more inflation to hold unemployment down. The 1970s proved them right, as both rose together.
The lesson central banks took away still shapes policy today: once inflation expectations become unanchored, bringing them back down is slow and costly, so it is better to act early.
Why stagflation is so hard to fix
A central bank's main tool is its policy interest rate. That is why, when inflation is high, the Fed aims to slow the economy: higher rates make mortgages, business loans and credit cards more expensive, which cools spending and hiring and eases pressure on prices. When the economy is weak, it cuts rates to encourage borrowing.
Stagflation presents both problems at once, so every move hurts something. As the Cleveland Fed puts it, cutting rates can push inflation higher, while raising them can increase unemployment.
Governments face a similar bind. Spending more to support households can add to inflation, while cutting back can deepen the slowdown. Targeted help, such as temporary energy bill support, is the usual compromise. The longer-term cure is on the supply side: more energy sources, more productive investment and fewer bottlenecks.
What is deflation?
Deflation is a sustained fall in the general price level, meaning the inflation rate is below zero across the economy as a whole. A cheaper television or a seasonal sale is not deflation. Neither is disinflation, which means inflation is slowing but prices are still rising, for example from 5% to 3%.
Lower prices sound appealing, and some price falls are healthy. Technology has made computing power, phone calls and storage dramatically cheaper for decades because of productivity gains, not weak demand. The deflation economists worry about is the broad kind caused by collapsing spending, and it can feed on itself in three ways:
- Delayed spending. If prices are expected to be lower next year, households and firms put off big purchases, which weakens demand further.
- Falling wages and profits. Firms selling at lower prices cut pay, hours and jobs, so incomes shrink.
- Heavier debts. Loans are fixed in money terms. As prices and incomes fall, the same debt takes a bigger share of earnings to repay. The economist Irving Fisher called this spiral "debt deflation" after watching it during the 1930s.
A worked example: why falling prices can hurt borrowers
The figures below are illustrative. Sam earns $75,000 a year and owes $300,000 on a fixed mortgage, four times his salary. Suppose a deep deflation cuts prices and wages by 10%.
| Item | Before | After 10% deflation |
|---|---|---|
| Annual salary | $75,000 | $67,500 |
| Mortgage balance | $300,000 | $300,000 |
| Debt as a multiple of salary | 4.0x | 4.4x |
Sam's groceries are cheaper, but his debt is now about 11% heavier relative to his income. Multiply that across millions of households and businesses and you get more defaults, more cautious banks and less spending. Inflation does the reverse, gradually eroding the real value of fixed debts, which is one reason central banks target a small positive rate, typically 2%, rather than zero.
Deflation in history: the Great Depression and Japan
The United States, 1929 to 1933
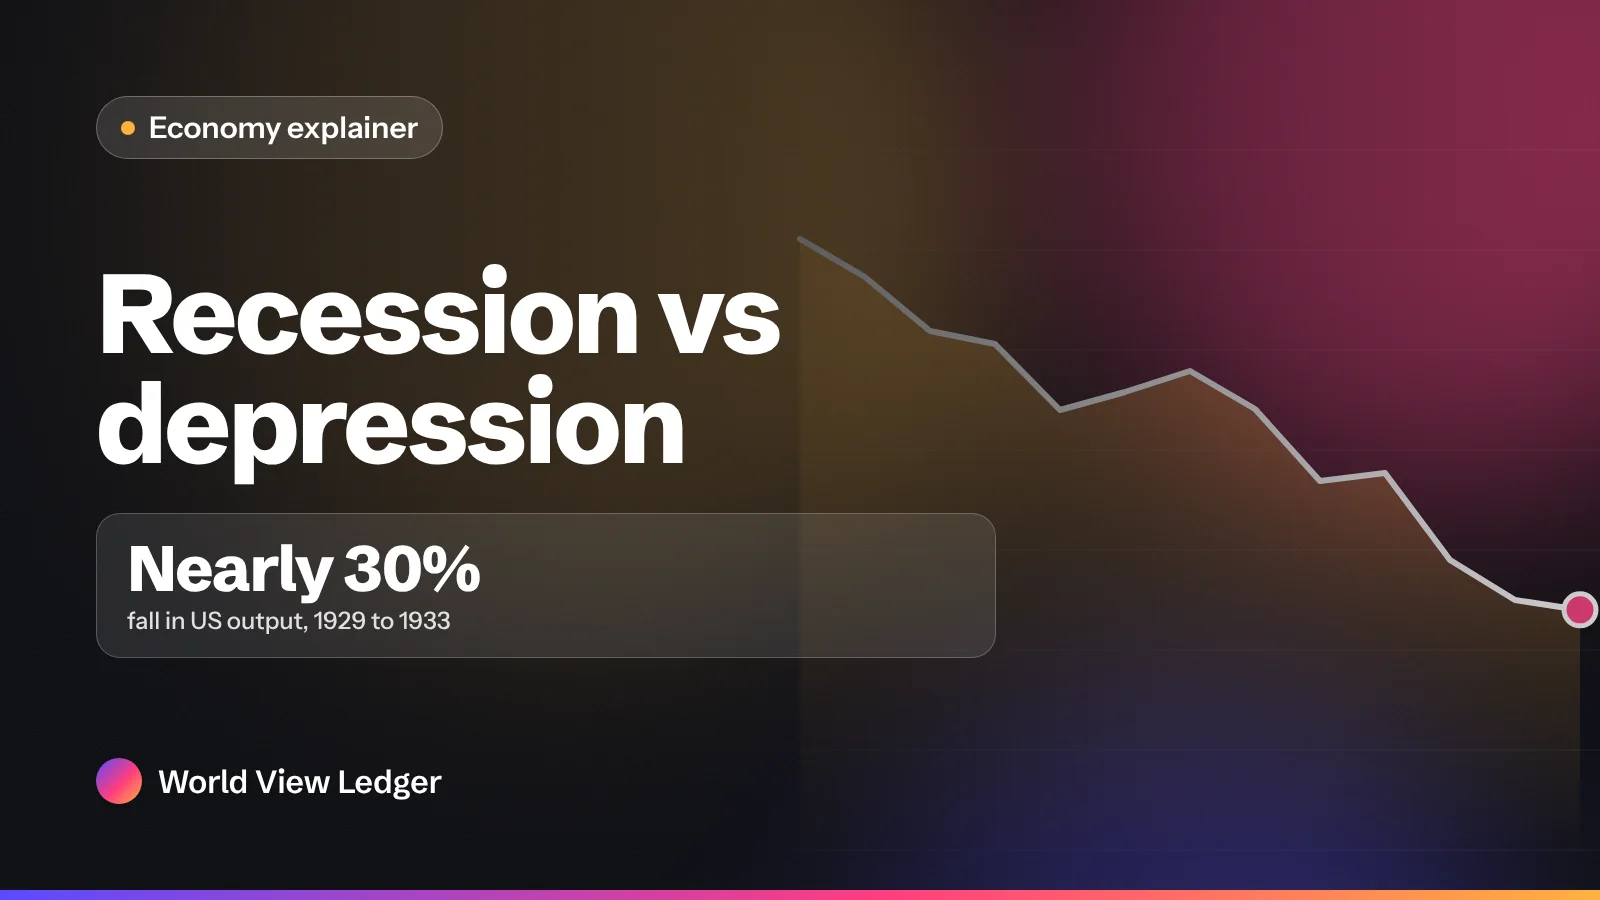
The most severe deflation in modern US history came with the Great Depression. According to the Federal Reserve Bank of St. Louis, between 1929 and 1933 real GDP fell 29%, consumer prices fell 25% and unemployment rose from about 4% to 25%. Roughly 7,000 banks, nearly a third of the system, failed between 1930 and 1933. Falling prices made debts harder to repay, which caused more failures, which pushed prices down further.
That experience shaped modern central banking. In a widely cited 2002 speech, then Fed governor Ben Bernanke argued that a central bank willing to use unconventional tools, such as buying large amounts of assets, could always prevent sustained deflation. Those tools, later known as quantitative easing, were used heavily after 2008.
Japan's long, mild deflation
Japan shows a quieter version of the problem. As Bank of Japan deputy governor Shinichi Uchida explained in a 2024 speech, Japan's deflation began in the late 1990s and lasted about 15 years, with prices falling by an average of only about 0.3% a year. The declines were small, but the persistence mattered: firms and workers came to expect flat prices and flat wages, which made it very hard to restart growth. The Bank of Japan adopted a 2% inflation target and large-scale asset purchases in 2013 to break that mindset.
Europe and China
The euro area briefly slipped into deflation after the oil price collapse of 2014, with annual inflation at minus 0.6% in January 2015, a key reason the European Central Bank launched large-scale bond buying that year. More recently, China spent a long stretch with falling factory-gate prices and consumer inflation near zero. That has now reversed: in October 2026, China's producer prices were up 5.7% on a year earlier, the fastest rise since June 2022, driven by higher raw material and mining costs, while consumer prices rose just 0.7%, according to official data from China's National Bureau of Statistics.
Stagflation vs deflation: the key differences
| Stagflation | Deflation | |
|---|---|---|
| Prices | Rising fast | Falling |
| Growth | Weak or negative | Usually weak or negative |
| Typical cause | Supply shock, such as an oil price spike | Collapse in demand, debt crisis, or falling expectations |
| Who is hurt most | Savers and people whose wages lag prices | Borrowers, indebted firms and workers facing pay cuts |
| Central bank response | Usually raise rates, accepting a slowdown | Cut rates toward zero, then buy assets |
| Classic example | The US and UK in the 1970s | The US in 1929–33; Japan from the late 1990s |
The two have one thing in common: both are driven partly by expectations. Once people believe prices will keep rising, or keep falling, their behavior tends to make it happen. That is why central banks spend so much effort on communication and credibility.
Is there stagflation now? The US, UK, Australia and UAE compared
As of November 2026, the main pressure on prices is energy. Disruption to shipping through the Strait of Hormuz since early 2026 has pushed up oil and fuel costs worldwide. Whether that adds up to stagflation depends on what growth and jobs are doing, and the answer differs by country.
| Country | Latest inflation | Growth and jobs | Policy rate |
|---|---|---|---|
| United States | 3.7% (year to Sep 2026) | Real GDP +3.4% annualized in Q3; unemployment 4.1% in Oct | 3.75%–4% (raised in Sep 2026) |
| United Kingdom | 3.6% (year to Oct 2026) | Bank of England expects recent GDP strength to fade | 4% (raised 5 Nov 2026) |
| Australia | 4.3% (year to Sep 2026) | RBA says the economy is slowing and unemployment has risen | 4.85% (fifth rise of 2026, 3 Nov) |
| UAE | 2.4% forecast for 2026 | Real GDP growth forecast 1.6% for 2026, then a rebound | 3.65% base rate (as of July 2026) |
United States: inflation, but not stagnation
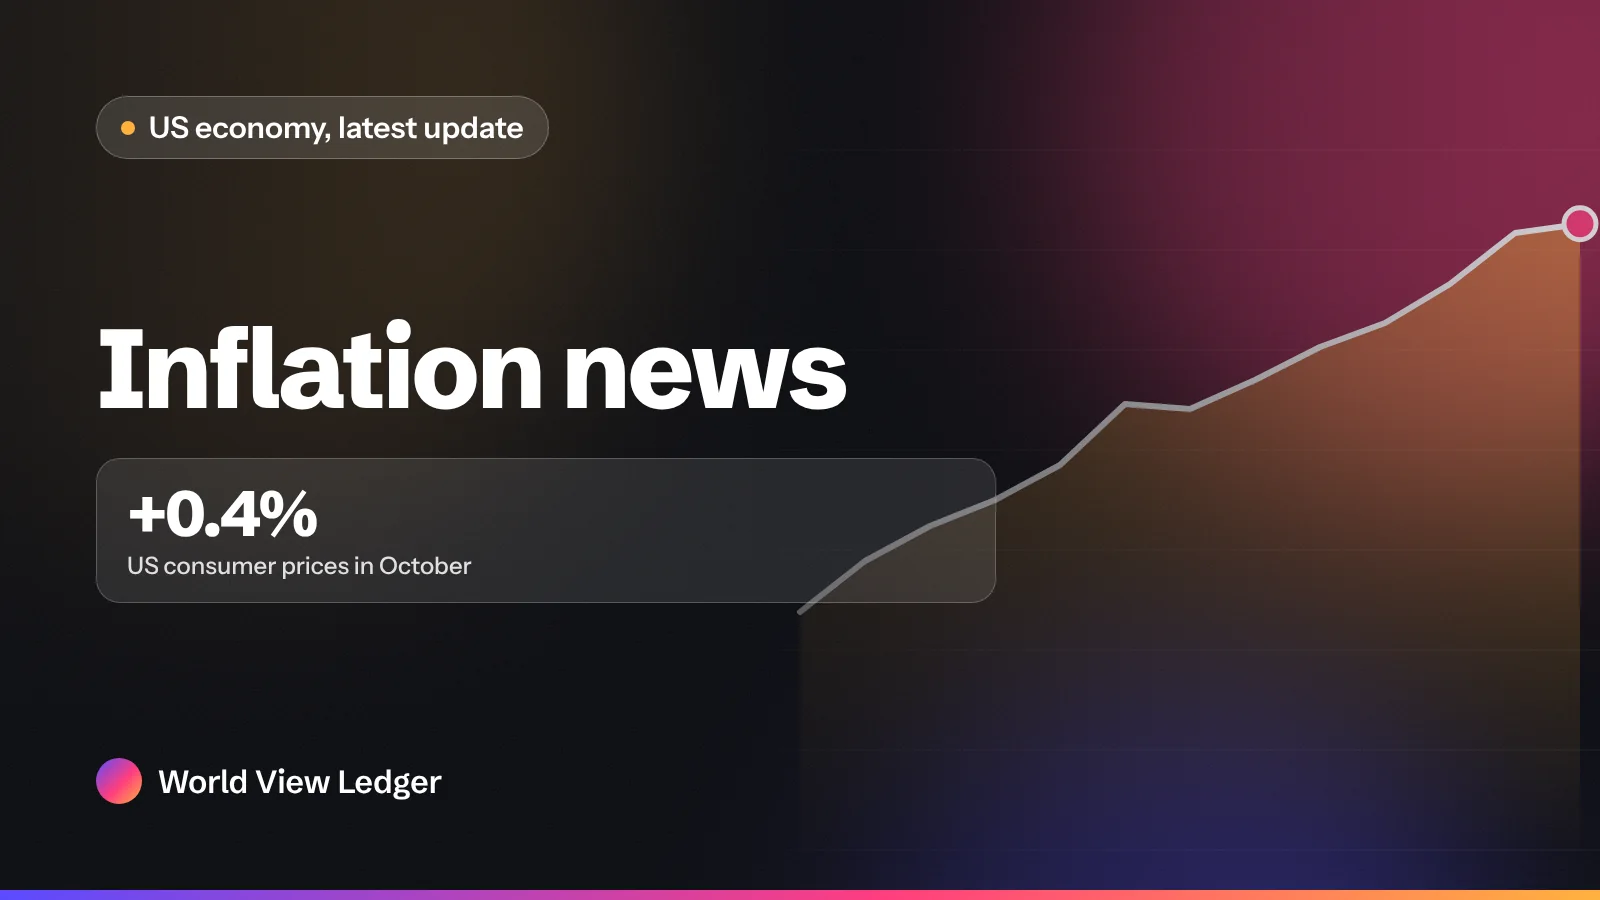
Gasoline prices rose 34.2% in the year to September 2026, helping lift headline inflation to 3.7%, according to the Bureau of Labor Statistics. The BLS could not publish a 12-month rate for October because no October 2025 prices were collected during last year's government shutdown. Prices rose 0.4% in October alone. But growth is strong and unemployment low, so the US has an inflation problem rather than stagflation. The Fed raised rates in September, held in October, and minutes of that meeting show most officials expect further increases will likely be needed. Our inflation news page tracks each new price report and Fed decision.
United Kingdom: rising inflation, cautious growth
UK inflation rose to 3.6% in October, with motor fuel prices up 33.2% over the year, the Office for National Statistics reported. The Bank of England raised Bank Rate to 4% on a vote of 8 to 1 and now expects inflation to rise to around 5% by the middle of 2027, while warning that recent GDP strength is likely to fall back somewhat. If that slowdown arrives while inflation peaks, the UK would move closer to stagflation territory.
Australia: closest to the textbook definition
Australian inflation reached 4.3% in the year to September, led by housing and fuel. The Reserve Bank of Australia lifted the cash rate to 4.85% on 3 November in a six to three vote, its fifth increase of the year. In the same statement it said the economy is slowing, house prices have fallen and the unemployment rate has risen, and it does not expect inflation to return to the top of its 2–3% target range until late 2027. Higher inflation, slowing growth and rising unemployment together are what stagflation looks like. Falling house prices are also reshaping property investment, alongside the changes to negative gearing.
UAE: an oil producer's different story
For the UAE, the shock cuts both ways. The Central Bank of the UAE reports that oil output fell to an average of 2.0 million barrels a day from March to May 2026, from 2.9 million a year earlier, before recovering to a near record 3.8 million in June and July. It forecasts inflation of 2.4% in 2026 and real GDP growth of 1.6%, rising sharply in 2027. Because the dirham is pegged to the US dollar, UAE interest rates broadly track the Fed rather than responding to local conditions.
What stagflation or deflation means for you
Neither situation is something an individual can control, but understanding them helps with everyday decisions.
- Your pay in real terms. If your salary rises 3% while prices rise 5%, your purchasing power falls by roughly 2%. In stagflation, it is worth checking your real raise, not just the headline number.
- Borrowing costs. Central banks fighting stagflation raise rates, so variable mortgages and credit card debt get more expensive. Paying down high-interest debt matters more.
- Savings. Cash loses value quickly when inflation is high. In deflation, cash gains value but jobs and incomes are less secure.
- Jobs. Both conditions raise the risk of unemployment. An emergency fund is the standard protection, and our guide to recession vs depression explains the warning signs that tend to flash before job losses mount.
This article is general information, not financial advice. See our disclaimer.
The bottom line
Stagflation is inflation without growth, usually triggered by a supply shock and made worse when inflation expectations take hold. Deflation is falling prices with weak demand, which can quietly trap an economy for years. The 1970s showed how costly stagflation is to end, while the 1930s and Japan showed how hard deflation is to escape. As of November 2026, the energy shock has revived stagflation fears, but the picture varies: the US has inflation with solid growth, the UK is on watch, and Australia is the closest of the four to the real thing. For more on the forces shaping prices, jobs and interest rates, browse our economy coverage.
Frequently asked questions
What is stagflation in simple terms?
Stagflation is when prices keep rising quickly while the economy stalls and more people lose their jobs. Normally high inflation comes with a booming economy, so having both problems at once is unusual and painful.
What is deflation and is it good or bad?
Deflation is a sustained fall in the average level of prices across the economy, not just cheaper gadgets or a sale. Mild price falls driven by productivity can be harmless, but broad deflation caused by weak demand is usually bad, because people delay spending, firms cut wages and the real burden of debt rises.
Is stagflation worse than deflation?
They are bad in different ways. Stagflation squeezes household budgets right away and forces central banks to choose between fighting inflation and protecting jobs. Deflation tends to be slower but harder to escape, because interest rates cannot easily go below zero. Economists generally consider a deep deflation, like the early 1930s, the more dangerous of the two.
When inflation is high, what does the Fed aim to do to the economy?
When inflation is high, the Fed aims to slow the economy. It raises its policy interest rate, which makes borrowing more expensive, cools spending and hiring, and eases pressure on prices. When inflation is too low or the economy is in recession, it does the opposite and cuts rates.
Is the US in stagflation right now?
Not by the usual definition, as of November 2026. Inflation is elevated, at 3.7% in the year to September 2026, but real GDP grew at a 3.4% annual rate in the third quarter and unemployment was 4.1% in October. That is high inflation with solid growth, not stagnation.
What is the difference between deflation and disinflation?
Disinflation means inflation is slowing but prices are still rising, for example from 5% to 3%. Deflation means prices are actually falling, so the inflation rate is below zero.
- Infographic on Inflation: Stagflation, Federal Reserve Bank of Cleveland, 17 Nov 2025
- The Great Inflation, Federal Reserve History
- Prices for gasoline increased 34.2 percent over the year ended September 2026, U.S. Bureau of Labor Statistics, 16 Oct 2026
- Consumer Price Index – October 2026, U.S. Bureau of Labor Statistics, 10 Nov 2026
- The Employment Situation – October 2026, U.S. Bureau of Labor Statistics, 6 Nov 2026
- GDP (Advance Estimate), 3rd Quarter 2026, U.S. Bureau of Economic Analysis, 29 Oct 2026
- Federal Reserve issues FOMC statement, Federal Reserve Board, 16 Sep 2026
- Consumer price inflation, UK: October 2026, Office for National Statistics, 18 Nov 2026
- Bank Rate increased to 4% – November 2026 Monetary Policy Summary and Minutes, Bank of England, 5 Nov 2026
- CPI rose 4.3% in the year to September 2026, Australian Bureau of Statistics, 28 Oct 2026
- Statement by the Monetary Policy Board: Monetary Policy Decision, Reserve Bank of Australia, 3 Nov 2026
- Quarterly Economic Review, September 2026, Central Bank of the UAE, Sep 2026
- Price dynamics in Japan over the past 25 years (Shinichi Uchida), Bank for International Settlements, 29 May 2024
- How Bad Was the Great Depression? Gauging the Economic Impact, Federal Reserve Bank of St. Louis
- Deflation: Making Sure "It" Doesn't Happen Here (Ben S. Bernanke), Federal Reserve Board, 21 Nov 2002
- How did China's economy perform in October 2026?, China Briefing, 19 Nov 2026
- Euro zone inflation falls to -0.6% in January, RTÉ, 30 Jan 2015